Using MapInfo to represent geographic data
Sick of colouring in maps on the screen or on paper to represent geographic variation? MapInfo maps directly from tabulated data to maps. If you have a set of vocabularies in standardised orthographies and you want to show which language varieties share items, you can map directly from the vocabulary lists to thematic maps. No doubt there is cheaper software around that will do the same job, but I haven't found it.
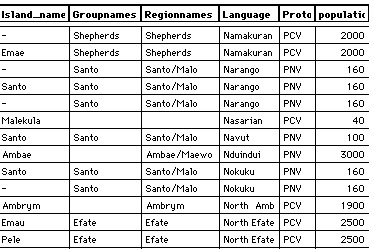
The following images show a dataset used to construct maps of Vanuatu's languages, with information about the number of speakers of each language (as displayed at HTTP://artalpha.anu.edu.au/web/arc/vks/vanlangs.htm). The data is tabulated like this:
|
|
Using the data it is possible to create maps such as the following. The base maps were created using an existing outline of the islands and tracing a scanned PICT file. This is fairly time-consuming, but then allows each language region to be treated as an entity.

MapInfo takes some effort to learn, and not all its functions are straightforward. But if you need to map data, this is the sort of tool you will need to do it.
Pros:
Cons: Expensive and requires training (not particularly
intuitive)
Current version: MapInfo 4 (MapInfo 3 reviewed here)
Platform: Macintosh, Windows
Application size: 2.6 Mb
Suggested minimum RAM: 2.2 Mb
Documentation: Paper manuals
Author: MapInfo
Available from: MapInfo
(www.MapInfo.com)
Review by:
Date: June 1998
Go back to the The Computer Assisted Language Worker (part two)